Ember: Real-time monitoring for Caddy and FrankenPHP is now available
Published on 30 March 2026
We’re thrilled to announce the release of Ember’s first version, the observability companion built for FrankenPHP and Caddy. As maintainers of these various open-source projects, we aim to provide everyone with the best possible monitoring experience, one that’s as integrated as possible, through this new companion. FrankenPHP and Ember are working hand in hand to create a whole new synergy within the ecosystem.
We’ve all been there: you just want to know what’s going on with your Caddy server, but you end up scrolling through a wall of Prometheus text or setting up yet another Grafana dashboard.
That’s exactly why Ember was created: a real-time dashboard in your terminal, zero-config, that launches with a single command. Think of it as an htop for your Caddy server. And if you’re using FrankenPHP, Ember goes even further.
Today, version 1.0.0 is available.
Vous cherchez la version française de cet article ? C’est par ici ! 🇫🇷

Observability is a must, and (it used to be) complicated
Caddy exposes a wealth of metrics through its admin API and Prometheus endpoint. That’s a great starting point. But in practice, you have two options: read raw Prometheus text (good luck spotting a problem in a wall of caddy_http_request_duration_seconds_bucket{le=“0.025”} 1847), or set up a full Grafana + Prometheus stack, with its configuration, dashboards to import, and infrastructure to maintain.
For a quick glance at traffic during development or for projects intended to be simple and/or lightweight, this is overkill.
And on the FrankenPHP side, the situation was even more striking: there was simply no tool to observe in real time what the PHP threads were doing. How many are busy? Which one is processing which request? For how long? What is the memory usage? These questions had no simple answers.
It’s a real challenge, especially when performance is at the heart of your vision. How can you quickly determine the best FrankenPHP autoscaling settings for your infrastructure?
The idea behind Ember: to make observability accessible, visual, and even enjoyable. To make you want to launch the tool to understand what’s happening immediately, with ready-to-read derived metrics rather than raw counters.
Zero-config: Just run ember init and you’re good to go
No configuration files to write, no YAML, no additional infrastructure. All it takes is two commands:
$ ember initThis wizard checks your Caddy configuration, detects whether metrics are enabled, and automatically enables them via the admin API if necessary. All without restarting Caddy.
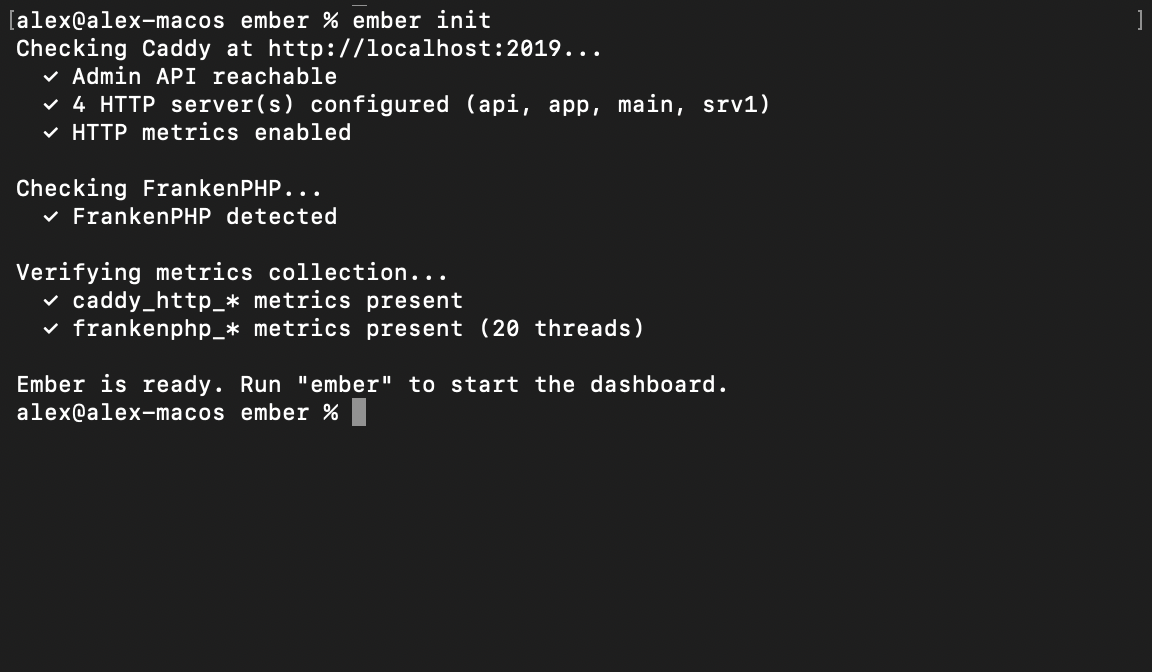
It also checks for the presence of FrankenPHP and alerts you if anything is missing.
Then:
$ emberThat’s it. Ember connects to Caddy’s admin API, automatically detects FrankenPHP if it’s present, and displays an interactive dashboard in your terminal.
And if your server is remote, Ember provides the --addr flag so you can specify the server’s URL.
A dashboard that really catches your eye
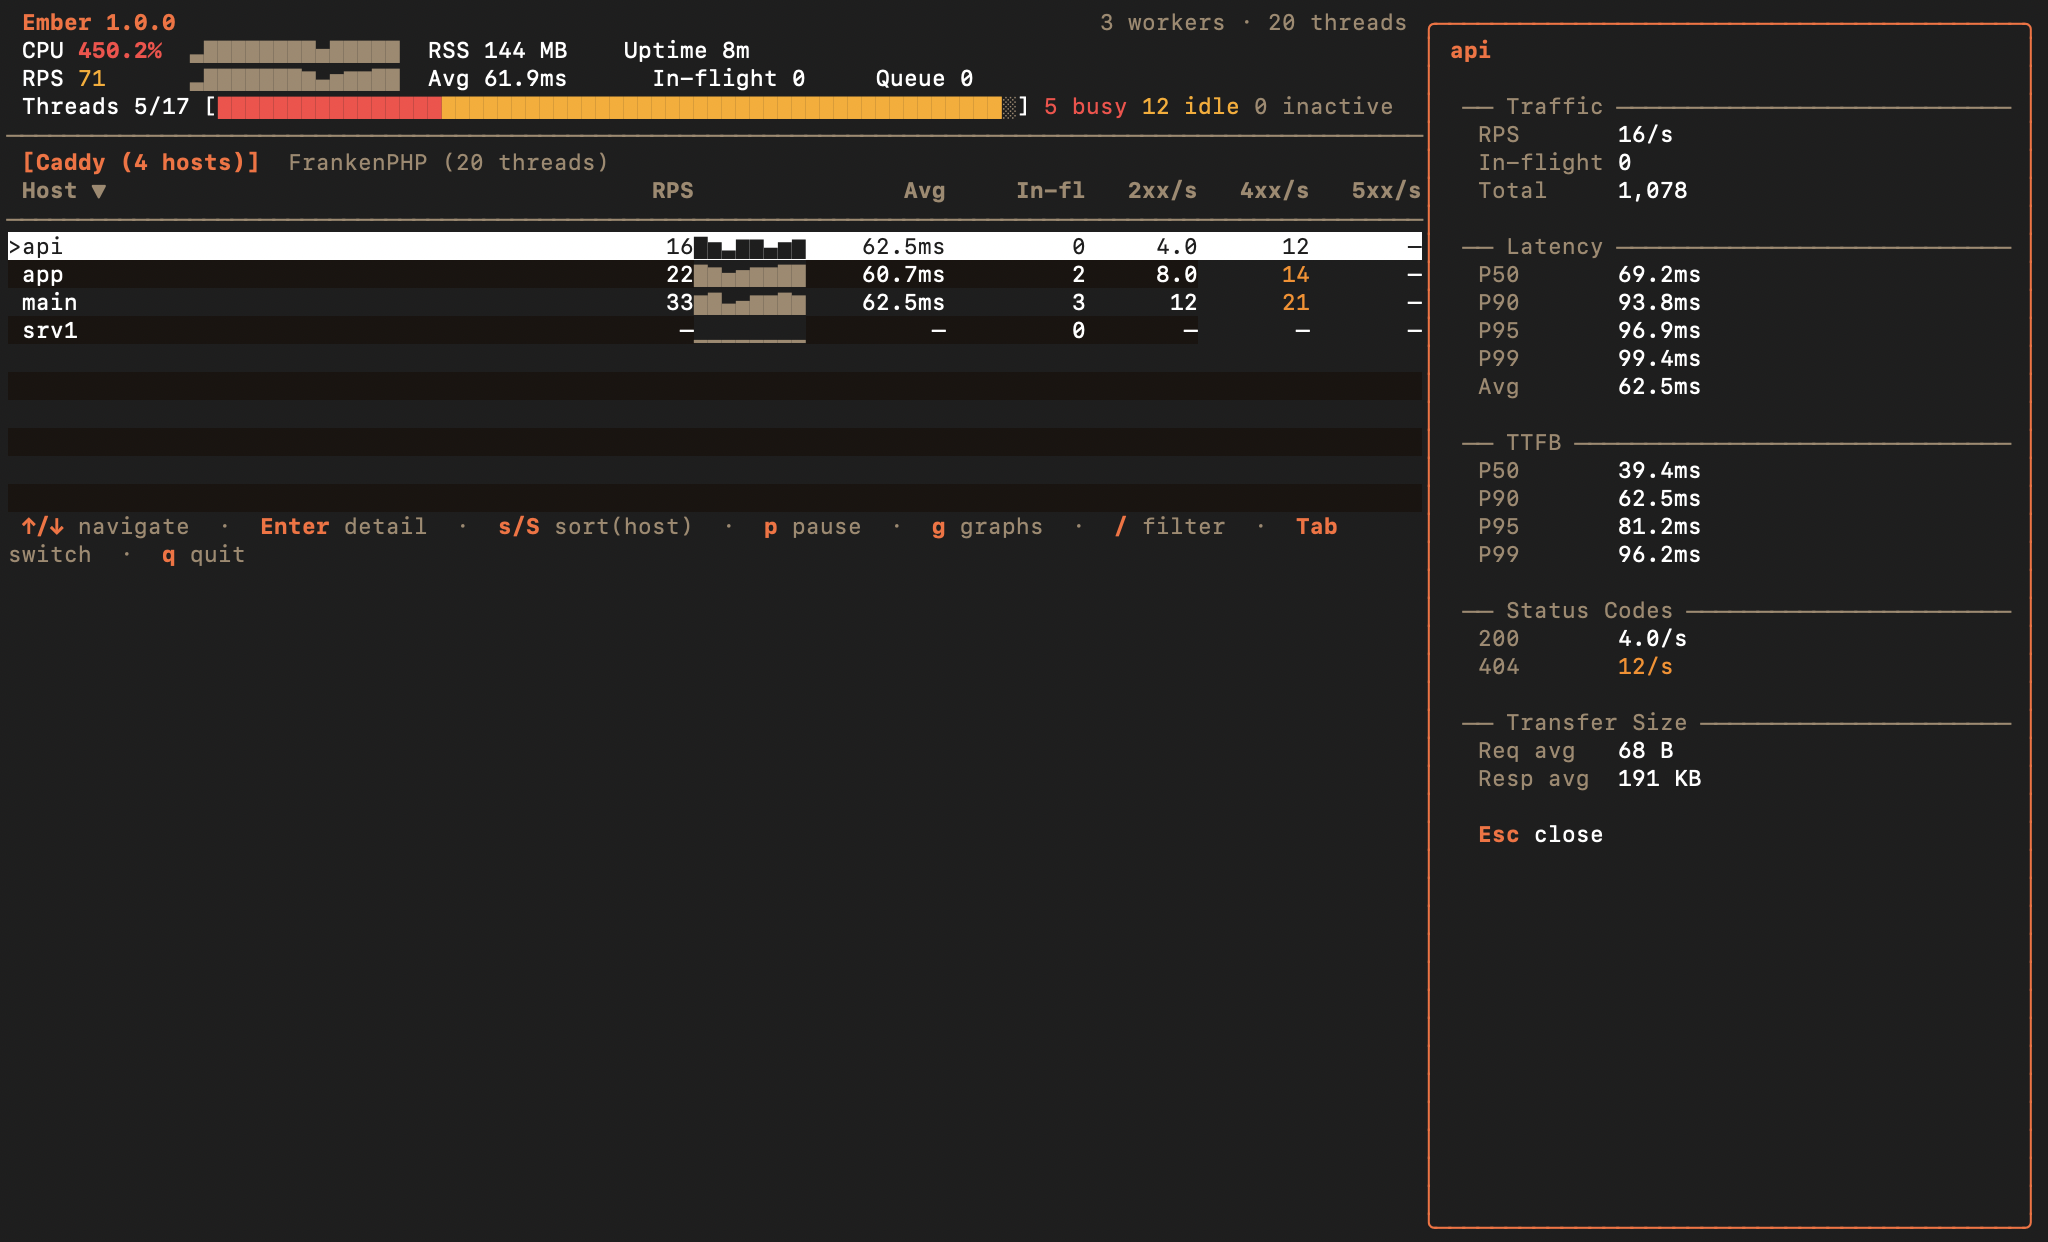
Whether you use Caddy on its own or with FrankenPHP, the main dashboard displays a traffic table by host with derived metrics calculated in real time:
- RPS (requests per second) with sparklines showing the trend over the last 8 samples
- Average latency and percentiles (P50, P90, P95, P99) calculated from Prometheus histogram buckets
- Time-to-First-Byte (TTFB) per host
- Status codes broken down: 2xx, 3xx, 4xx, 5xx per second, with an immediately readable color code
- In-flight requests per host
You can sort by any column, filter by host name, and switch to full-screen ASCII graphs to view trends in CPU, RPS, and RSS memory over the last 300 samples. Ember also automatically detects Caddy restarts and resets its counters accordingly.
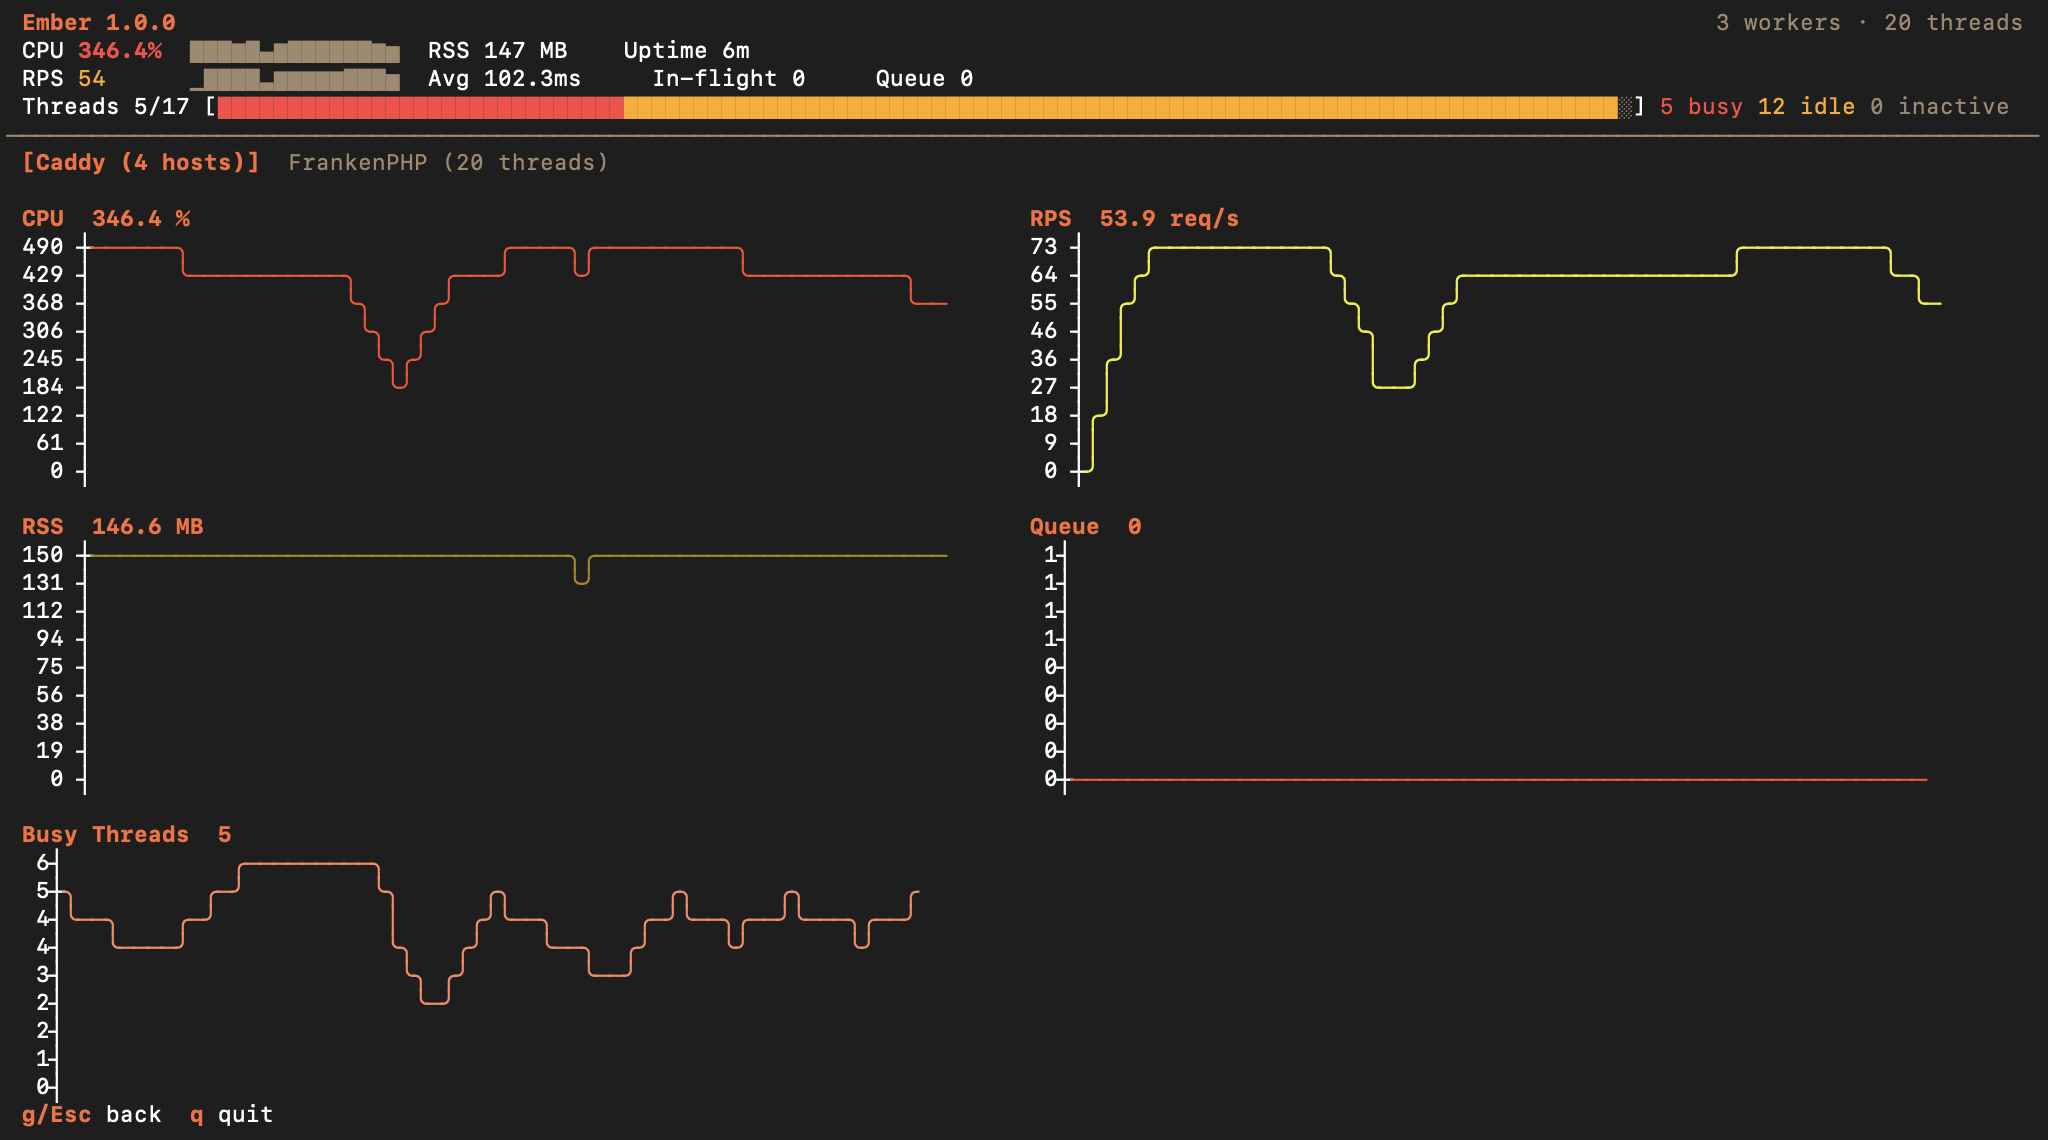
These aren’t raw metrics: they’re derived metrics, calculated by Ember, and ready to be read and understood at a glance.
Take it to the next level with FrankenPHP
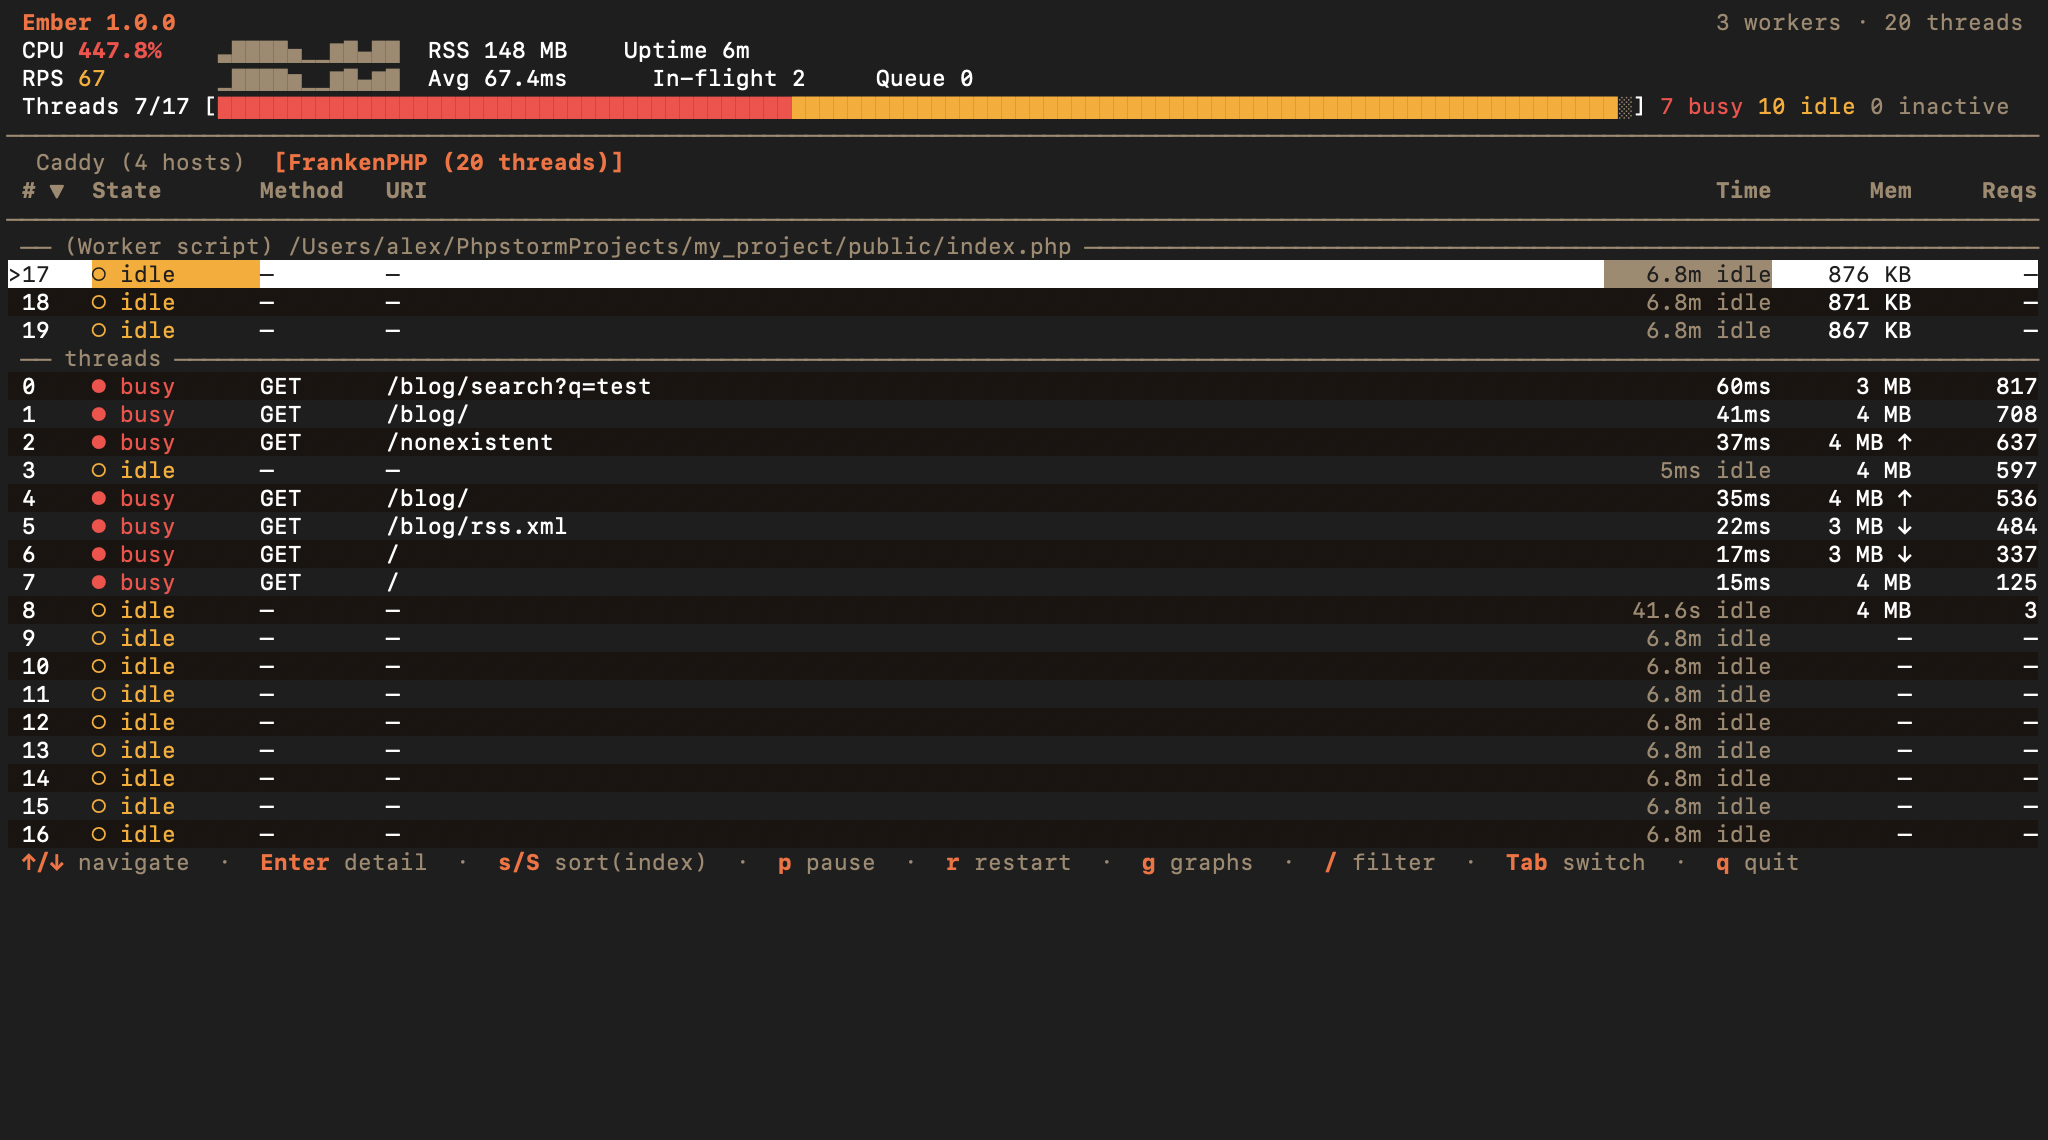
If you use FrankenPHP, Ember unlocks a key feature that has been difficult to implement until now. When FrankenPHP is detected, a second tab automatically appears, providing full visibility into each PHP thread:
- Status of each thread: busy, idle, waiting
- HTTP method and URI of the request currently being processed
- Duration of the current request, with a color-coded indicator that changes from yellow to red
- Memory used by the thread, with variation indicators (increase/decrease for changes exceeding 100 KB)
- Total number of requests processed by each thread
Threads are grouped intelligently: worker threads first (grouped by script), then standard threads. For workers, Ember also displays the queue depth, the number of crashes, and the number of restarts. You can even restart workers directly from the dashboard using the r key.
To make all of this possible, we contributed an upstream pull request to FrankenPHP (starting with up-coming version 1.13) to expose the necessary per-thread information. We are also taking this opportunity to add a dedicated page on observability to the FrankenPHP documentation, where Ember will be recommended as a monitoring tool.
From the terminal to production
Ember isn’t just an interactive dashboard: the tool is also designed for use in a cloud environment. One binary, multiple usage modes:
- Interactive TUI (default mode): ideal for development, with keyboard navigation, sorting, filtering, and charts.
- JSON streaming (
--json): each poll cycle outputs a JSON line to stdout. Perfect for feeding pipelines, scripts, or structured logging. Combine with –once for a one-time snapshot. - Daemon mode (
--daemon --expose :9191): Ember runs in the background and exposes a Prometheus-compatible/metricsendpoint, as well as a/healthzendpoint for Kubernetes readiness probes. Error throttling is built-in to prevent log flooding. - Health check (
ember status): one line, one result.Caddy OK | 5 hosts | 450 rps | P99 12ms | CPU 3.2% | RSS 48MB | up 3d 2h. Also available in JSON. - Readiness gate (
ember wait): blocks until Caddy responds. Ideal in a deployment script:ember wait && ./deploy.sh. - Deployment validation (
ember diff before.json after.json): compares two snapshots and detects performance regressions. Exit code 1 if a degradation greater than 10% is detected.
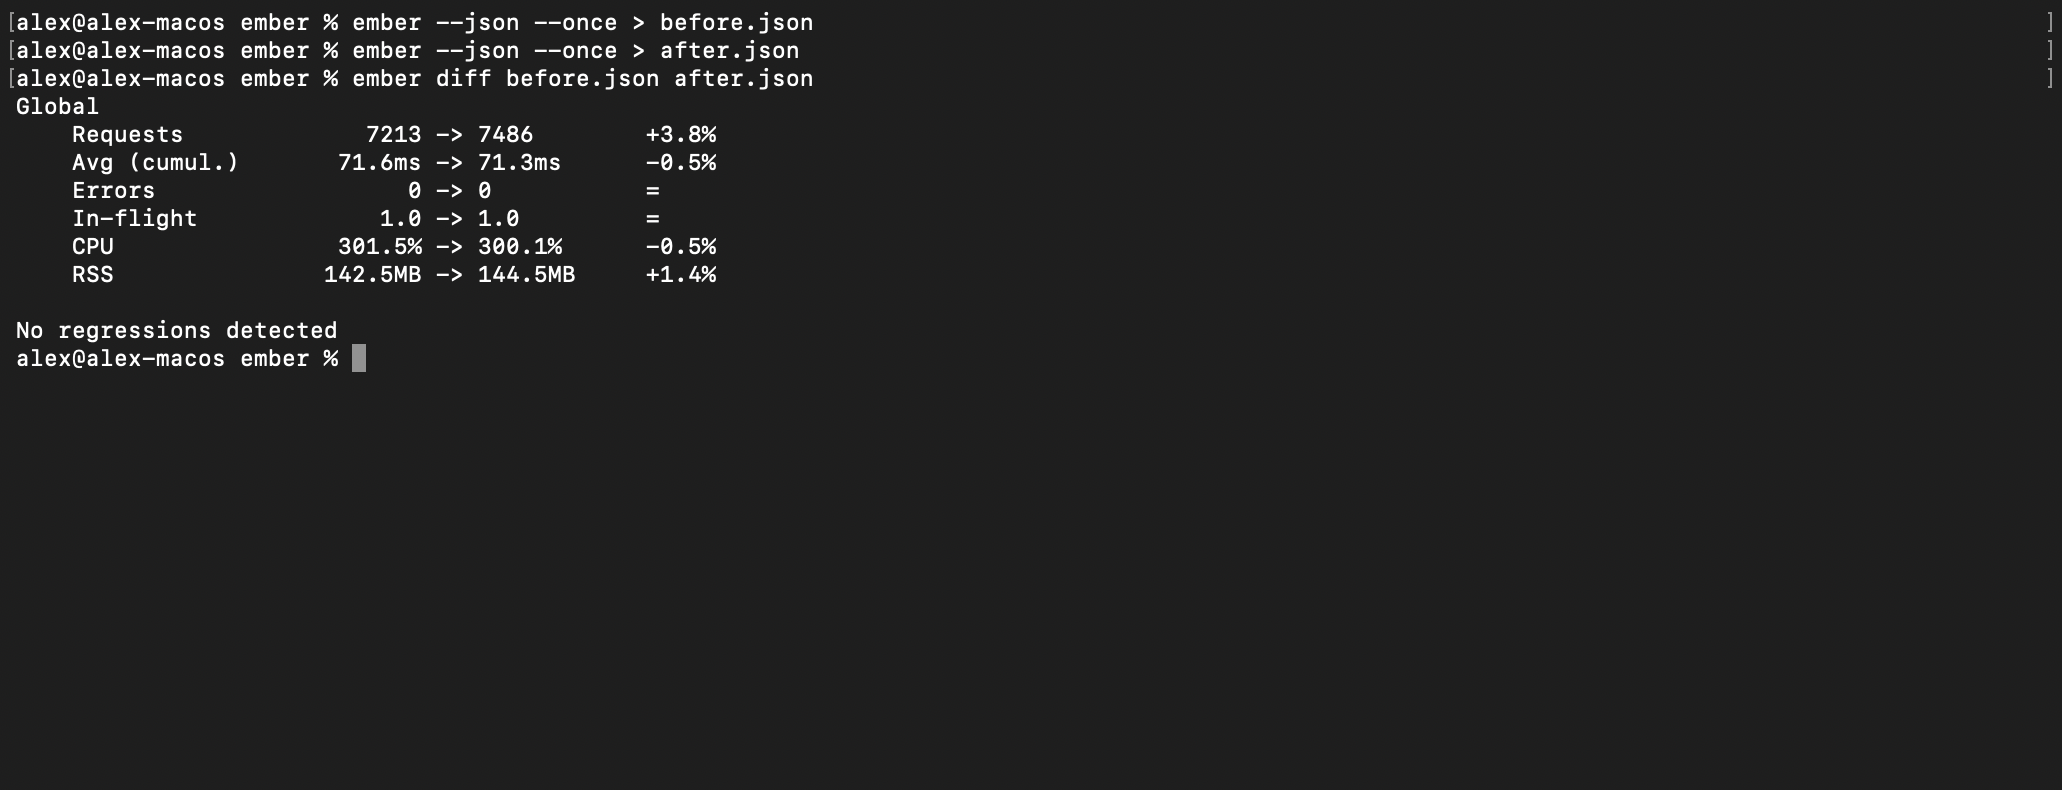
Ready for production
In terms of performance, Ember remains very lightweight: ~15 MB of RAM and ~0.3 ms per poll cycle, even with 100 FrankenPHP threads and 10 Caddy hosts. The monitoring tool won’t slow down what it’s supposed to monitor. Add to that:
- TLS and mTLS: custom CA certificates, client certificates, or skip verification
- Basic auth on the Prometheus metrics endpoint
- SIGHUP to reload TLS certificates on the fly, without restarting
- SIGUSR1 to dump the full state in JSON to stderr (debug in production)
- Multi-architecture Docker image (amd64/arm64), published on ghcr.io
- Environment variables (
EMBER_ADDR,EMBER_INTERVAL,EMBER_EXPOSE,EMBER_METRICS_PREFIX,EMBER_METRICS_AUTH) for container configuration NO_COLORsupport for accessibility
Install Ember today
With Homebrew:
$ brew install alexandre-daubois/tap/emberWith Go:
$ go install github.com/alexandre-daubois/ember/cmd/ember@latestWith Docker (using daemon mode by default):
$ docker run --rm --network host ghcr.io/alexandre-daubois/emberBinaries are available for Linux, macOS, and Windows, in amd64 and arm64.
Please contribute and share your ideas!
What would a tool like this be if it weren’t open-source, just like our other contributions to the PHP ecosystem? Ember is open-source under the MIT license. This is version 1.0.0, and it’s just the beginning.
If you use Caddy or FrankenPHP, we invite you to try out Ember, open issues if you encounter any problems, and submit pull requests if you feel like it. Every piece of feedback counts toward making Ember the go-to tool for monitoring the Caddy ecosystem.
The source code and complete documentation are available on GitHub: alexandre-daubois/ember. Do you like the tool? Don’t forget to star it on GitHub. We look forward to your feedback!