Ember 1.2 / 1.3: Logs, Plugins, and a Platform That Grows With You
Published on 28 April 2026
A few weeks back we shipped Ember 1.1 and turned a simple Caddy monitor into something closer to a control panel: a Config tab, a Certificates view, waterfall graphs, Unix socket support. The response was great: issues, PRs, users asking for “that one extra thing”. We recently surpassed more than 150 downloads per day, the announcement on Reddit has been a success and YoanDev posted a (French) YouTube video to showcase it. We reached 300 stars on GitHub. Thank you to everyone supporting Ember!
Two releases later, Ember 1.2 and 1.3 are the answer to those asks.
1.2 was about seeing more of what Caddy is already doing: live logs streamed straight into the TUI, an Upstreams tab for reverse proxies, and self-metrics so you can monitor the monitor. 1.3 is about letting you extend Ember yourself: a compile-time plugin system, a Runtime / Access split in the log viewer, and an official Docker image on Docker Hub.
This post walks through the highlights of both.
Live Logs, Straight Into the TUI
Before 1.2, watching Caddy logs meant tail -f in another terminal, or piping a JSON stream through jq. Ember was great at showing you what was happening (RPS, latencies, errors), but not why. The logs were somewhere else.
Ember 1.2 introduces live log streaming. At startup, Ember opens a TCP listener on loopback, registers two sinks in Caddy via the admin API, enables access logging on any server that didn’t already have a logs block, and starts parsing entries on the fly. No Caddyfile changes. No JSON wrangling. When you quit, everything Ember touched is unregistered and the config goes back exactly where it started.
The table follows live by default, status codes are color-coded, and / opens a case-insensitive filter that composes with whatever you’re viewing. Scrolling automatically freezes the buffer so a line you’re reading doesn’t slide out from under you; a PAUSED pill tells you how many new lines are queued in the background. Press f to resume.
If Caddy isn’t reachable when Ember starts, the listener stays open and a watchdog retries every 30 seconds until sinks are registered. The same watchdog handles caddy reload: sinks get re-registered automatically, so streaming resumes without you doing anything. On a remote Caddy or in Docker, pass --log-listen <addr> (or set EMBER_LOG_LISTEN) so Caddy has a reachable address to push to.
Runtime vs Access, Side by Side
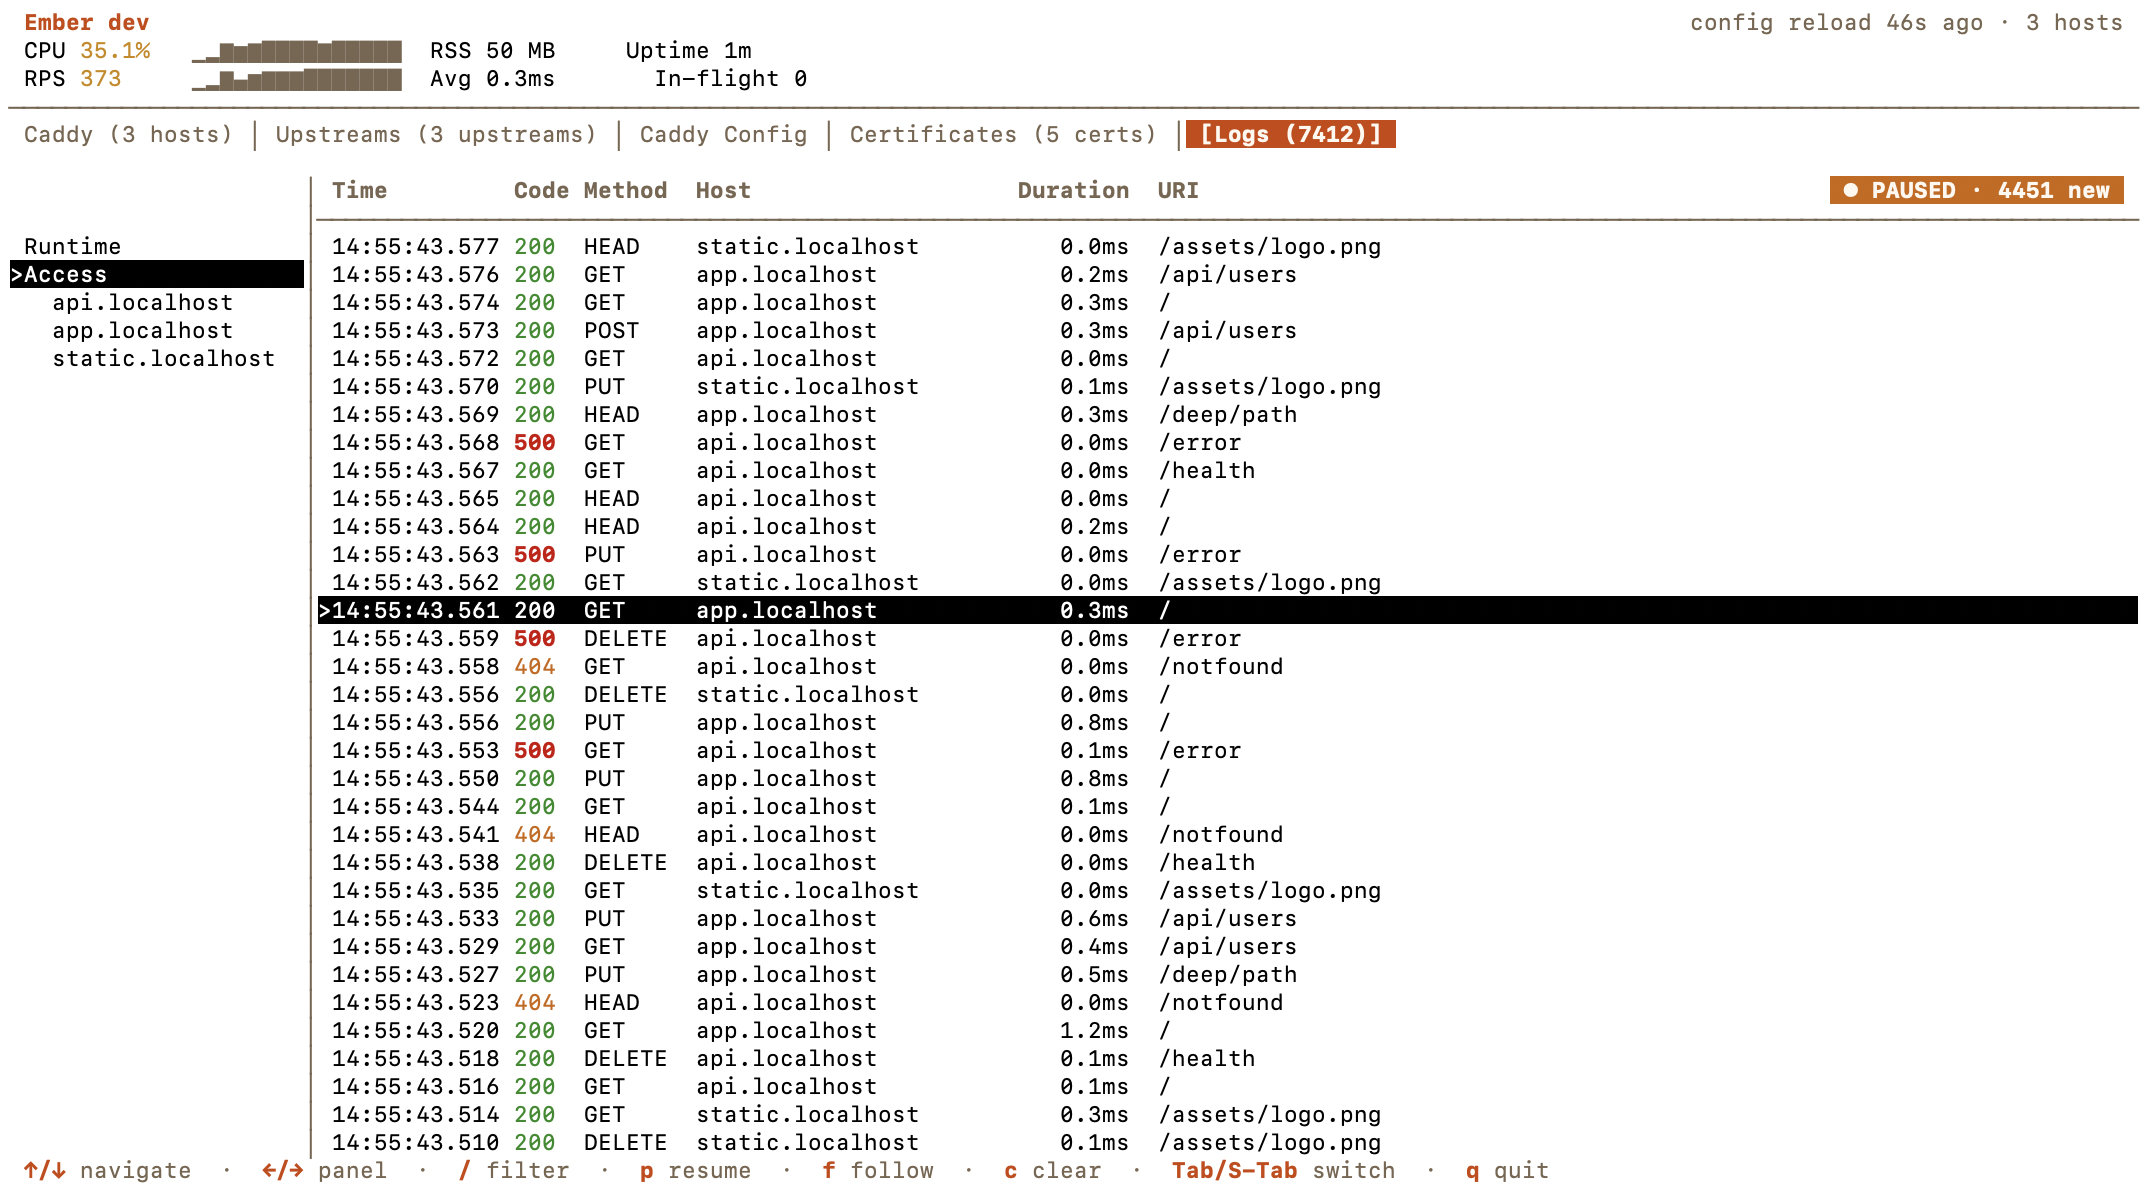
Streaming every line into one table works until your access traffic drowns out the handful of runtime events that actually matter: a failed TLS handshake, a module error, an admin API call. Ember 1.3 splits them cleanly.
The Logs tab now has a left sidepanel with two scopes: Runtime (startup, reloads, TLS, admin API, plugin logs) and Access (HTTP requests). The two streams live in separate in-memory ring buffers, 10 000 entries each, so a busy web server can’t evict rare runtime errors. Under Access, Ember lists the hosts it has actually seen in recent traffic; selecting one narrows the table to that host and drops the Host column so URIs get more room.
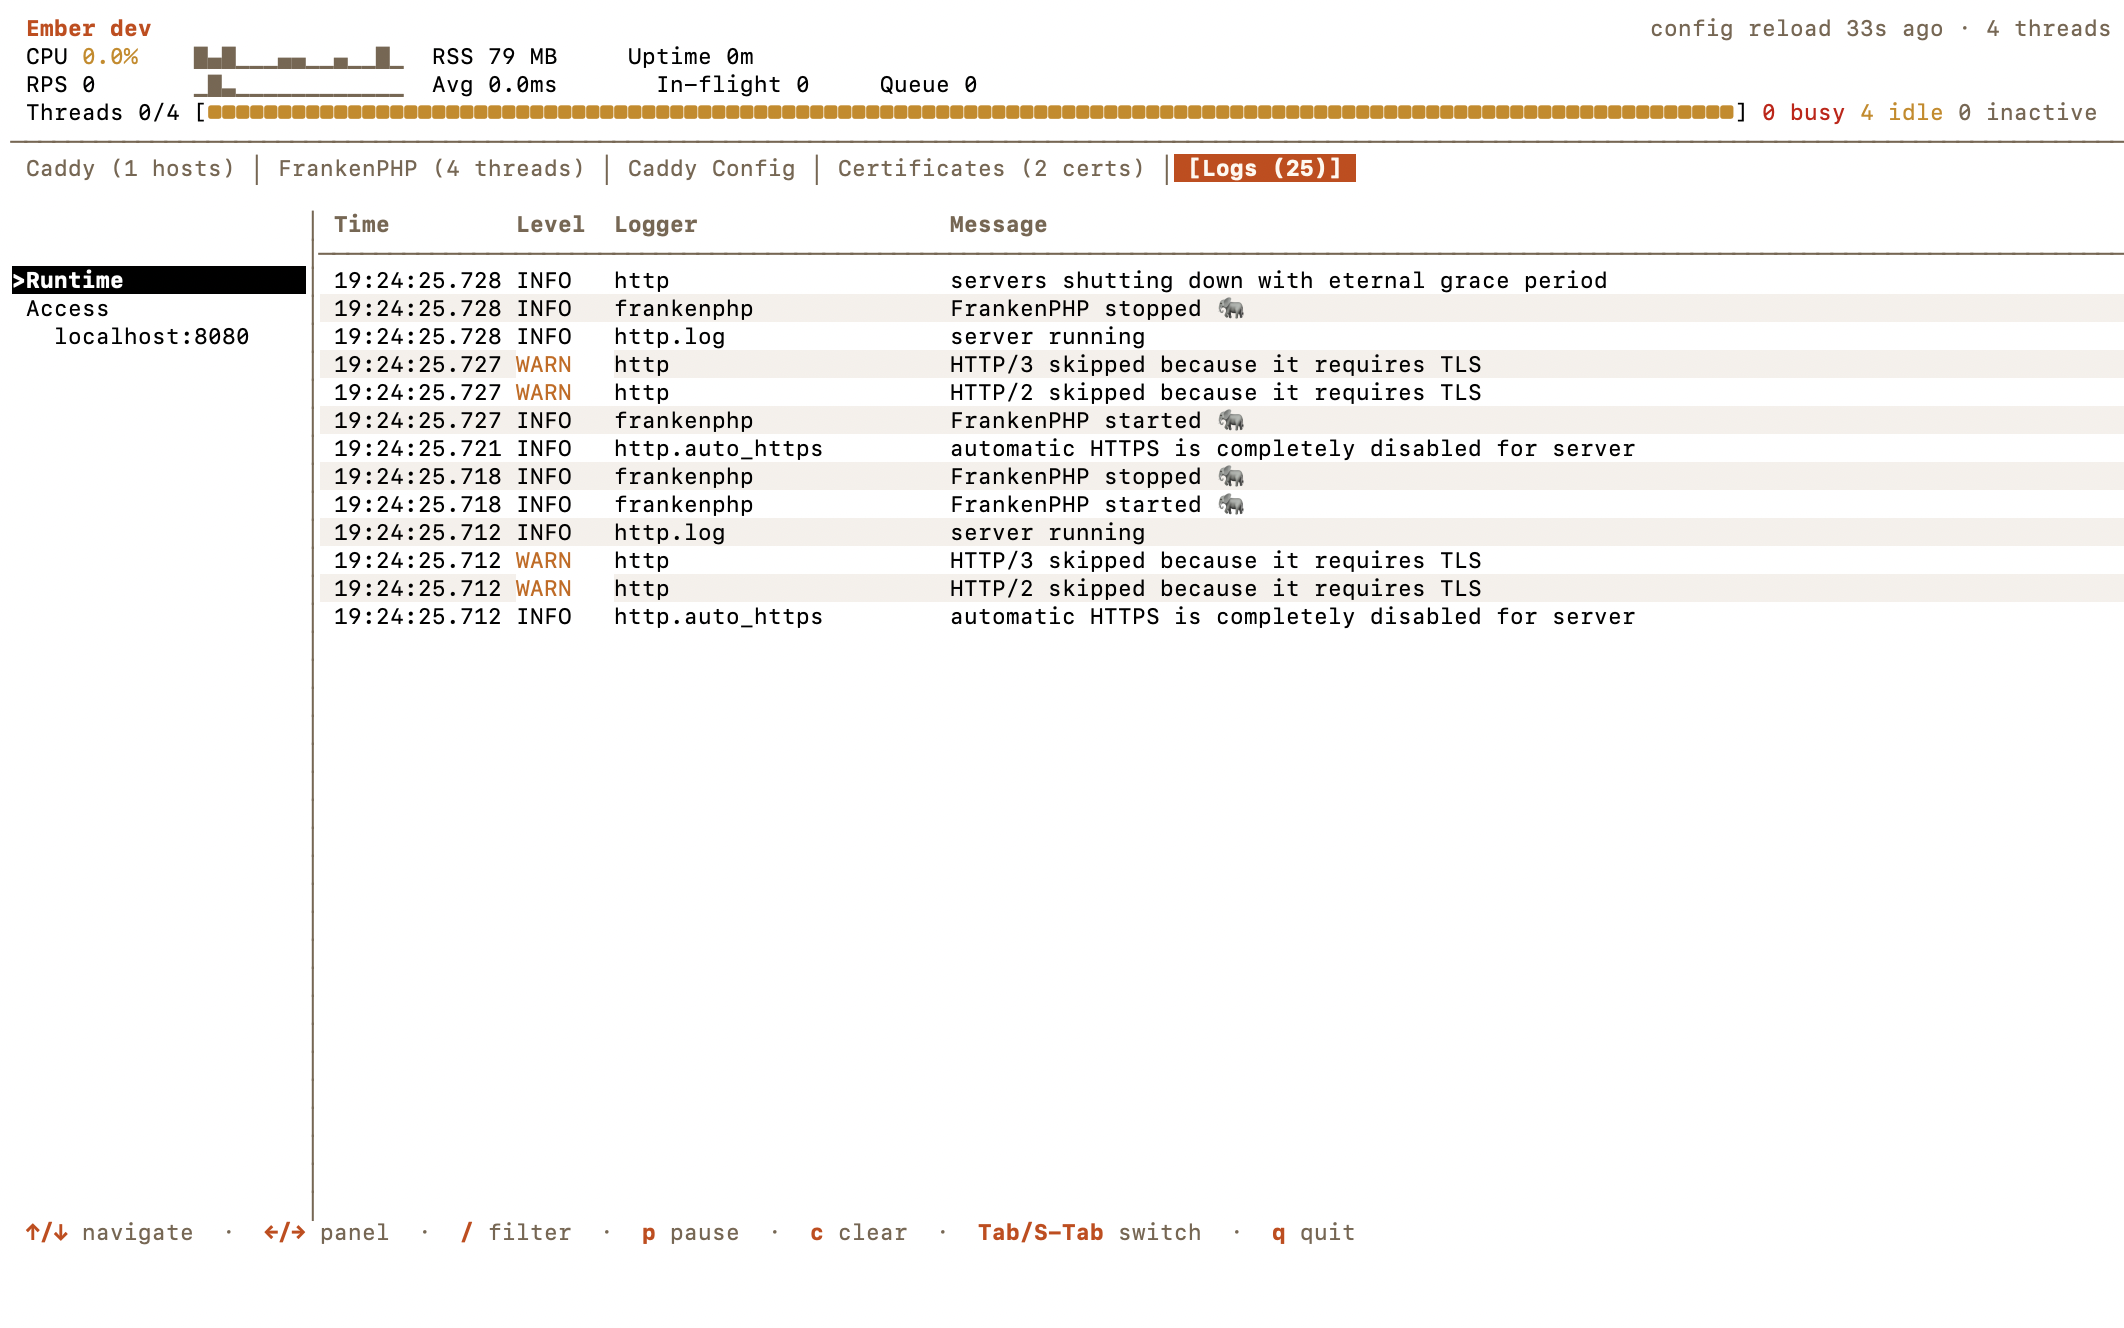
The Runtime view gets its own column set: Time, Level, Logger, Message. Severity is color-coded (red ERROR/FATAL, orange WARN), but because Ember must stay usable under NO_COLOR, severity also has a textual prefix: ! for ERROR, * for WARN, so the signal survives even without color.
From the Caddy tab, press l on any host to jump straight to the Logs tab pre-filtered on that host’s access entries. That “I saw a 500 in the table, show me the actual log line” round-trip is now one keystroke.
The Upstreams Tab
Ember already surfaced per-host traffic. What it didn’t show was the other side of the reverse proxy: the upstreams themselves. 1.2 adds a dedicated Upstreams tab that appears automatically as soon as Caddy exposes caddy_reverse_proxy_upstreams_healthy, which happens the moment you have at least one reverse_proxy handler configured.
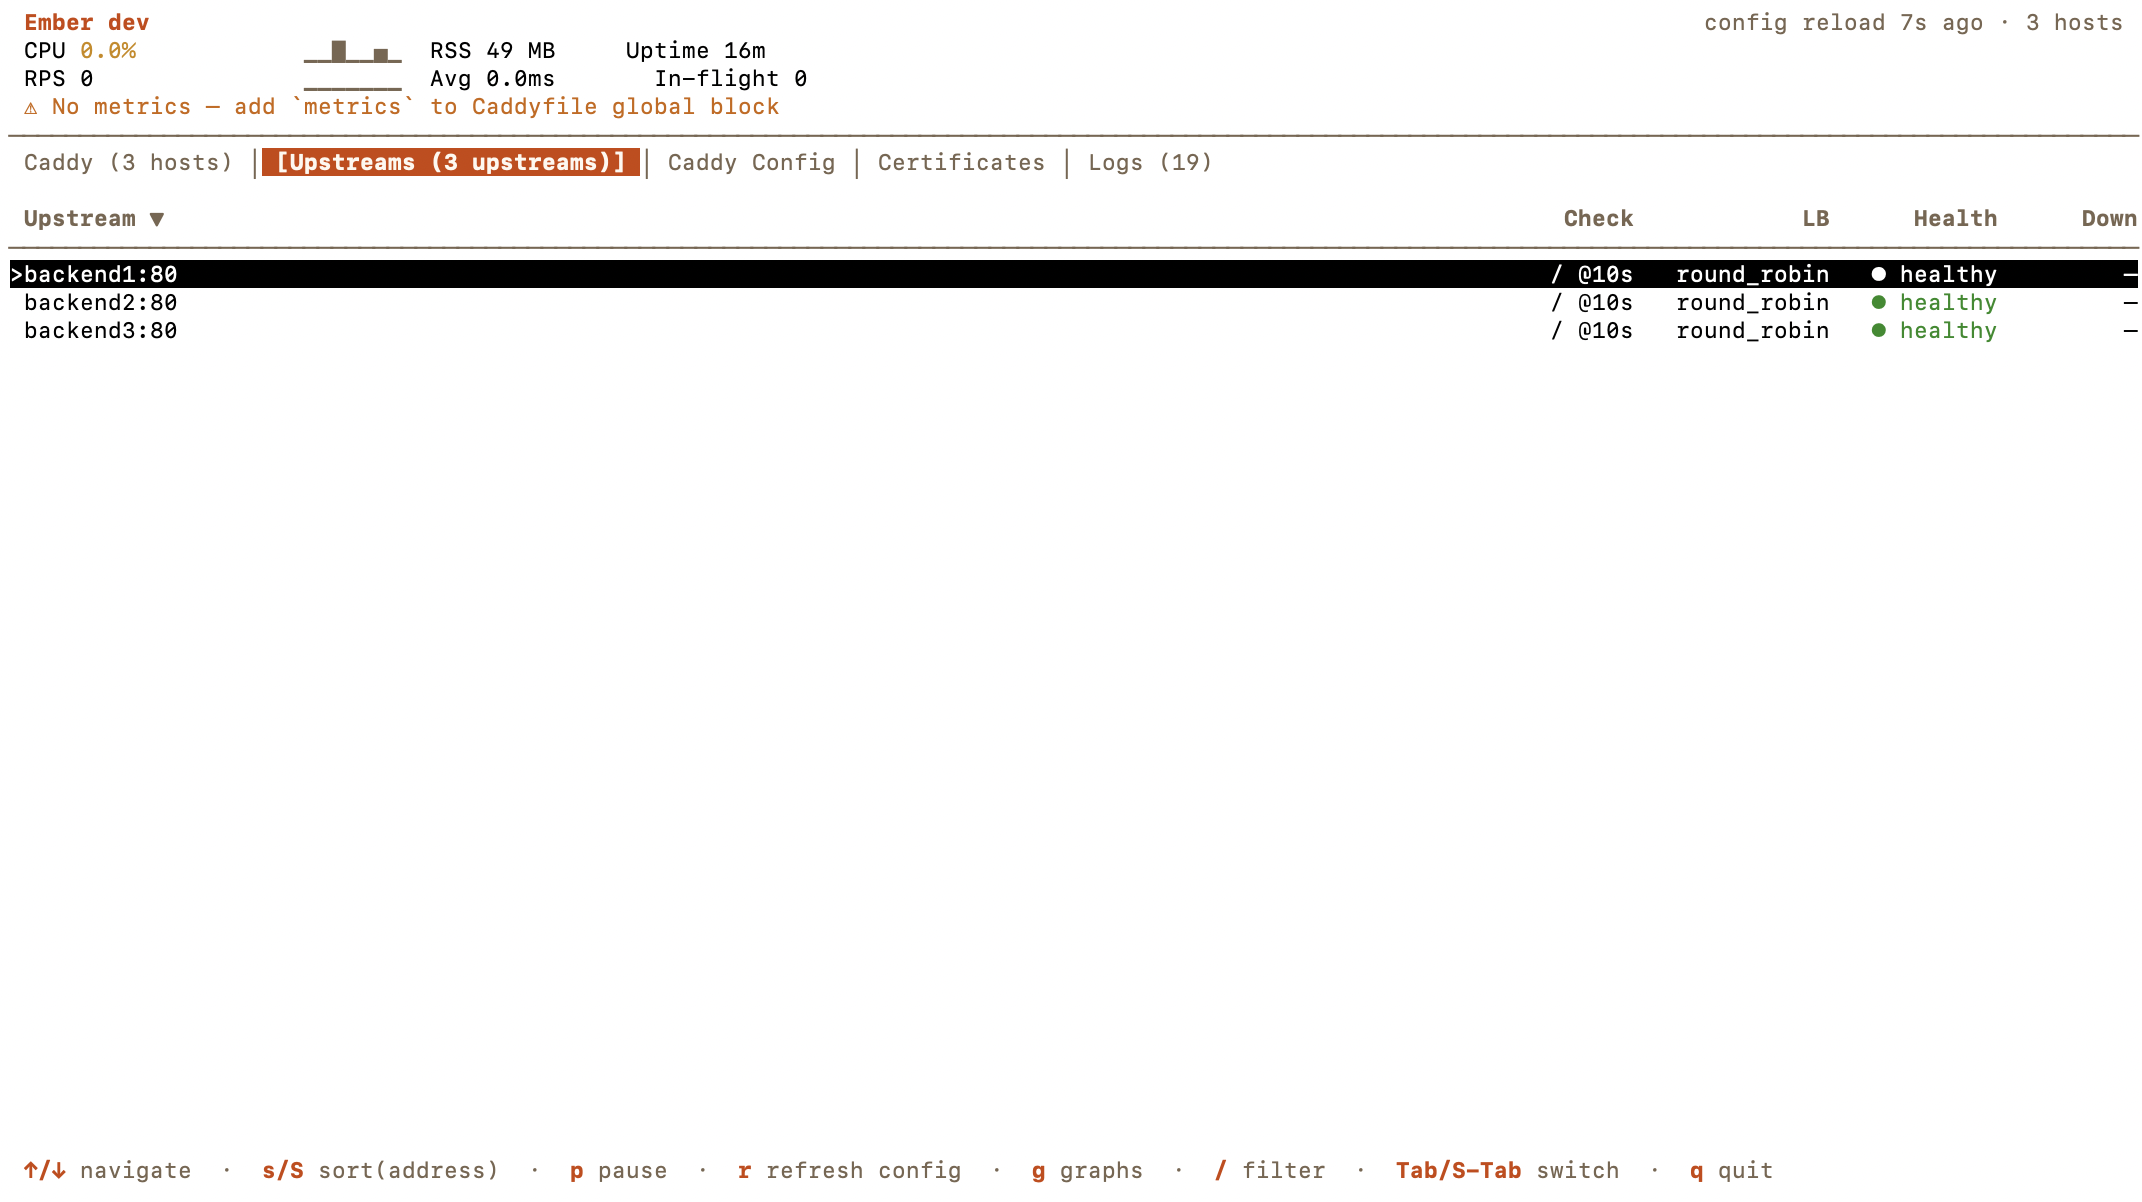
Health checks and load-balancing policies are extracted from the live Caddy config, not guessed. A ! suffix on the status means the state just flipped since the last poll, so a flapping backend stands out visually without you having to stare at the table. Sort with s/S, filter with /, refresh the config-sourced columns with r.
Monitor the Monitor: Ember Self-Metrics
If Ember sits in your observability stack, it needs to tell you when it is struggling. 1.2 adds Ember self-metrics that appear on /metrics whenever --expose is set, alongside the Caddy and FrankenPHP metrics you already scrape:
ember_build_info: constant1, labeled withversionandgoversion.ember_scrape_total/ember_scrape_errors_total: counters per sub-fetch stage (threads,metrics,process).ember_scrape_duration_seconds: latency of the last scrape per stage.ember_last_successful_scrape_timestamp_seconds: when each stage last succeeded.
Which means you can finally alert on the things that matter:
rate(ember_scrape_errors_total[5m]) > 0
time() - ember_last_successful_scrape_timestamp_seconds{stage="metrics"} > 60
ember_scrape_duration_seconds{stage="metrics"} > 1
Ember is no longer a black box in your Prometheus.
A Plugin System for Your Own Caddy Modules
Caddy’s ecosystem is huge: rate limiters, WAFs, caches, auth modules, custom middleware. Ember can’t possibly have a tab for every one of them. So 1.3 makes it your job, in the nicest way possible.
Ember 1.3 ships with a compile-time plugin system. Plugins follow the exact same pattern as Caddy modules: blank imports plus init() registration. You drop them into a small main.go that calls ember.Run(), go build, and you have a custom Ember binary with the extra tabs, the extra Prometheus metrics, or both.
package main

import (
    "fmt"
    "os"

    "github.com/alexandre-daubois/ember"

    _ "github.com/example/ember-ratelimit"
    _ "github.com/example/ember-cache"
)

func main() {
    if err := ember.Run(); err != nil {
        fmt.Fprintln(os.Stderr, err)
        os.Exit(1)
    }
}
A plugin implements a tiny surface: Name, Provision, Fetch, and then picks what it wants to do with the data: render a TUI tab (Update, View, HandleKey), write Prometheus metrics (WriteMetrics), or both. Configuration comes from the environment: EMBER_PLUGIN_RATELIMIT_MAX_RPS=1000 lands in PluginConfig.Options["max_rps"]. Ember wraps every call with panic recovery, so a broken plugin shows “plugin error: …” in its tab instead of taking the whole TUI down with it.
Export-only plugins, Fetcher + Exporter, no Renderer, collect data and add it to /metrics without touching the interface at all. Perfect for feeding a Grafana board without cluttering the terminal.
The plugin API is labeled experimental on purpose: interfaces may still move as we learn what people actually build with it. If an interface feels clunky or doesn’t expose something you need, open an issue: the API will grow to match real use cases!
Ember on Docker Hub
Until 1.2 the container image only lived on ghcr.io. 1.3 publishes both on GitHub Container Registry and Docker Hub:
alexandredaubois/emberghcr.io/alexandre-daubois/ember
Same image, same content, pick whichever registry your platform prefers. The image is still built FROM scratch (static binary plus CA certs, no OS, no shell) and still defaults to --daemon --expose :9191, so you can drop it in as a sidecar without overriding anything:
docker run --rm --network host alexandredaubois/emberBeyond the Headline Features
A lot of smaller changes landed across 1.2 and 1.3:
ishortcut for the interval flag:ember -i 2sinstead ofember --interval 2s.- Breadcrumb in the host detail panel: you always know which host you’re inspecting.
- Refreshed tab styling and better table height handling across the board.
- Smarter FrankenPHP worker-reset detection, independent of Caddy’s own counter resets.
- Race fix on the HTTP fetcher during TLS reload (
SIGHUP): no more occasional scrape blips when rotating certs. - Startup validation: invalid
--metrics-prefixvalues, or a--timeoutshorter than--interval, are now rejected at startup instead of producing broken scrapes. - Percentile correctness: we no longer return cumulative histogram counts as percentiles when we don’t have a baseline snapshot yet.
- P90 in the JSON streaming output and in the tracker fallback path.
- Always-second FrankenPHP tab when it’s detected, so your mental map of the tab bar stays stable.
A word on the [BC BREAK] in 1.2
One metric cleanup is worth calling out. Ember 1.2 stops mirroring a handful of Caddy metrics that Caddy already exposes on its own /metrics endpoint. If you were scraping both, you had duplicates; if you were scraping only Ember, you might have been reading Ember-reshaped values instead of Caddy’s canonical ones. 1.2 treats Caddy as the source of truth for everything Caddy already exposes, and Ember’s /metrics now only adds value on top. If you were relying on an Ember-side copy of one of those metrics, point your dashboard at the Caddy endpoint directly.
Get Ember 1.3 today!
Homebrew:
brew upgrade emberWith go install:
go install github.com/alexandre-daubois/ember/cmd/ember@latestOne-liner:
curl -fsSL https://raw.githubusercontent.com/alexandre-daubois/ember/main/install.sh | shAnd of course Docker:
docker pull alexandredaubois/ember
# or
docker pull ghcr.io/alexandre-daubois/ember
The source lives at github.com/alexandre-daubois/ember. Issues, PRs, and plugin ideas are all very welcome: 1.3’s plugin API in particular will evolve based on what you try to build with it!